The Conversation (0)
News
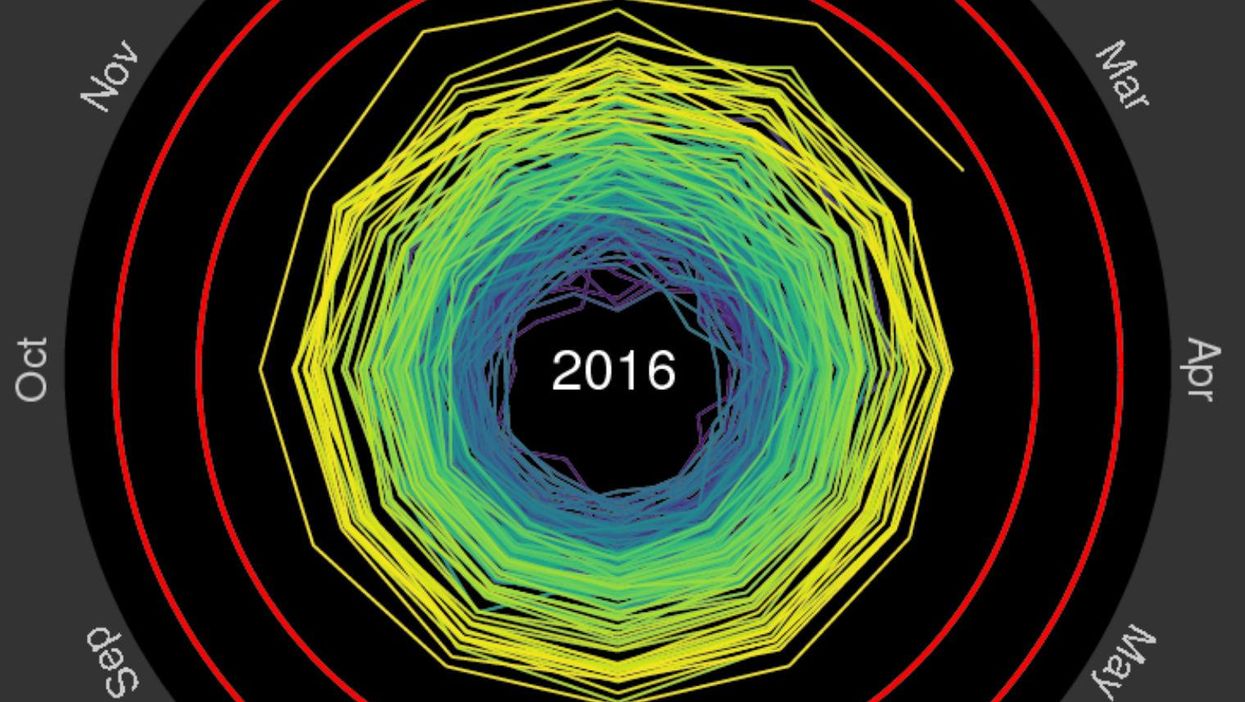
Any optimism climate scientists had after the agreements made at the Paris summit in December must have been dented by the start of this year.
The first three months of 2016 have smashed temperature records and even with the best international cooperation, the targets to limit global warming to 1.5 or 2 degrees compared to pre-industrial levels are looking increasingly unlikely.
It has also emerged this week that three islands in the Pacific have disappeared thanks to sea level rise and erosion.
To highlight this increasing rate of warming, University of Reading climate scientist Ed Hawkins has created a visualisation that shows the change in global temperatures from 1850-2016.
Using data from the Met Office Hadley Centre, it shows how rapidly the global temperature has risen in the past few decades:
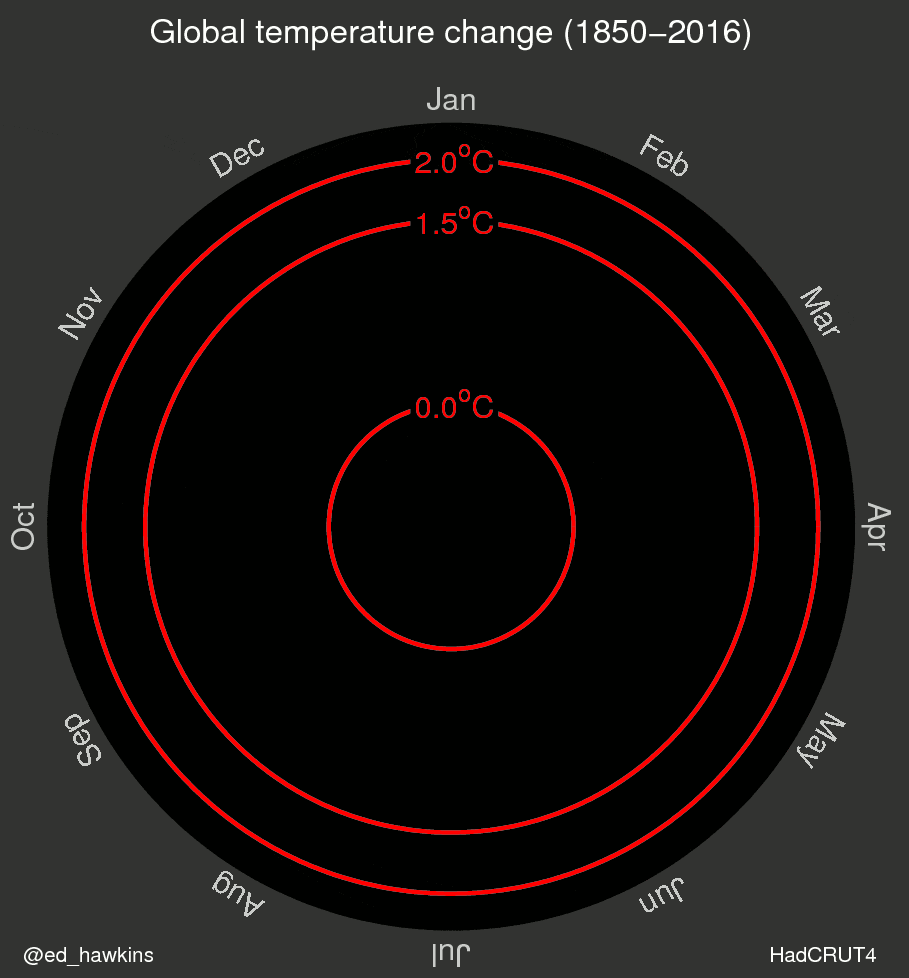
Writing on the Climate Lab Book blog where he's an editor, Hawkins explained:
The animated spiral presents global temperature change in a visually appealing and straightforward way. The pace of change is immediately obvious, especially over the past few decades.
The relationship between current global temperatures and the internationally discussed target limits are also clear without much complex interpretation needed.
Visualisation reproduced with kind permission of Ed Hawkins
More: Here's how fast global warming is happening - in one terrifying 30 second video
More: World leaders have done their bit on climate change, now here are 10 ways you can too