The Conversation (0)
News
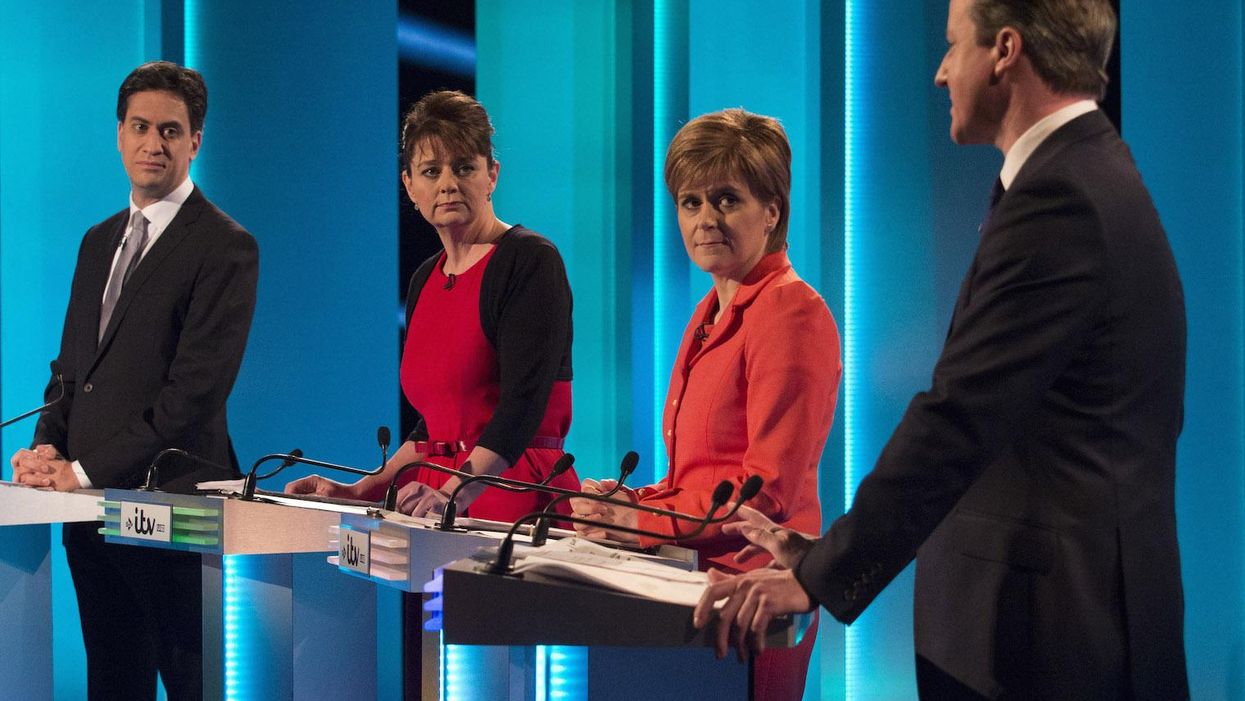
The Electoral Commission released a big chunk of juicy data on Wednesday.
It showed the expenditure of parties during campaigns in the 2015 UK general election.
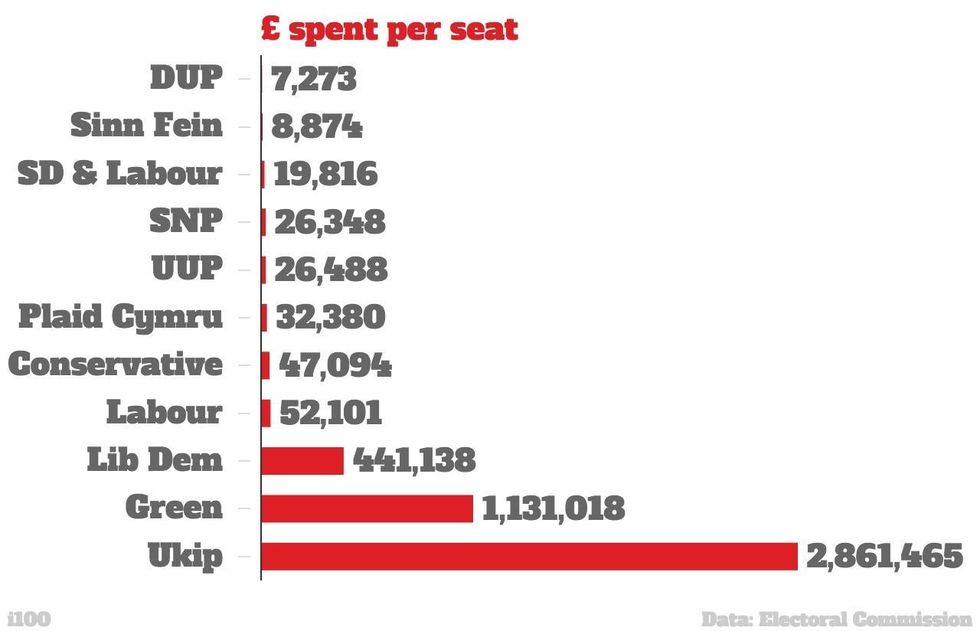
The Tories spent £15,587,956, Labour spent £12,087,340, the Lib Dems spent £3,529,106, Ukip spent £2,851,465, the SNP spent £1,475,478 and the Greens spent £1,131,018, to name the biggest budgets.
From this data, you can work out how much each party spent per seat won:
If the parties were all given the same budget, this would translate to a parliament which looks like this:
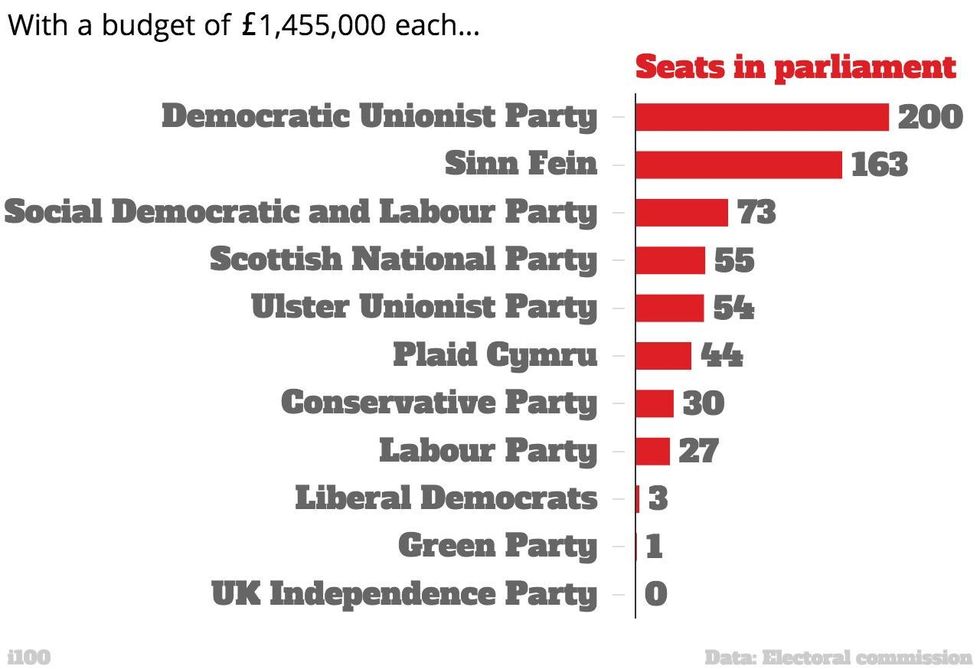
Except it wouldn't, because (as you were about to point out) there are only 18 constituencies in Northern Ireland, meaning the DUP and Sinn Fein probably wouldn't have 363 between themselves.
The parties that competed cross-borders, the Conservatives, Labour, Lib Dems, Greens and Ukip, won 573 seats between them.
So assuming that they only have those seats to fight over as Sinn Fein, DUP, Plaid Cymru and co all win their seats, who wins with an equal budget?
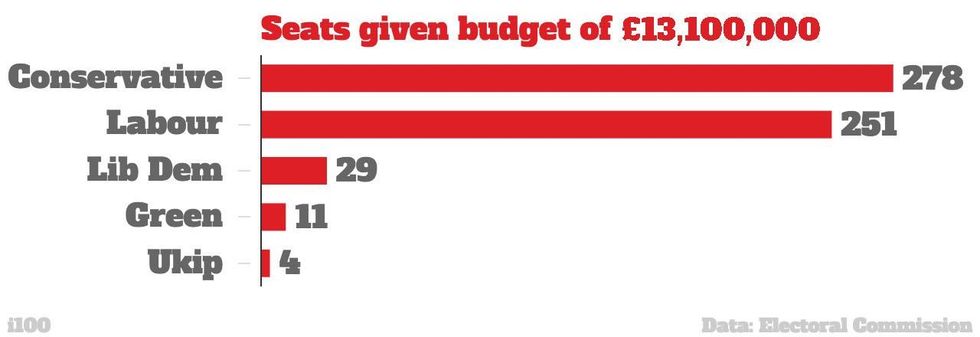
Still the Tories it seems. Of the national parties, their money-spent-to-seats-won ratio is the strongest.
Between them, seat-winning parties won 30,347,830 votes at the general election.
In terms of the amount of money they spent per vote, the table looks like this:
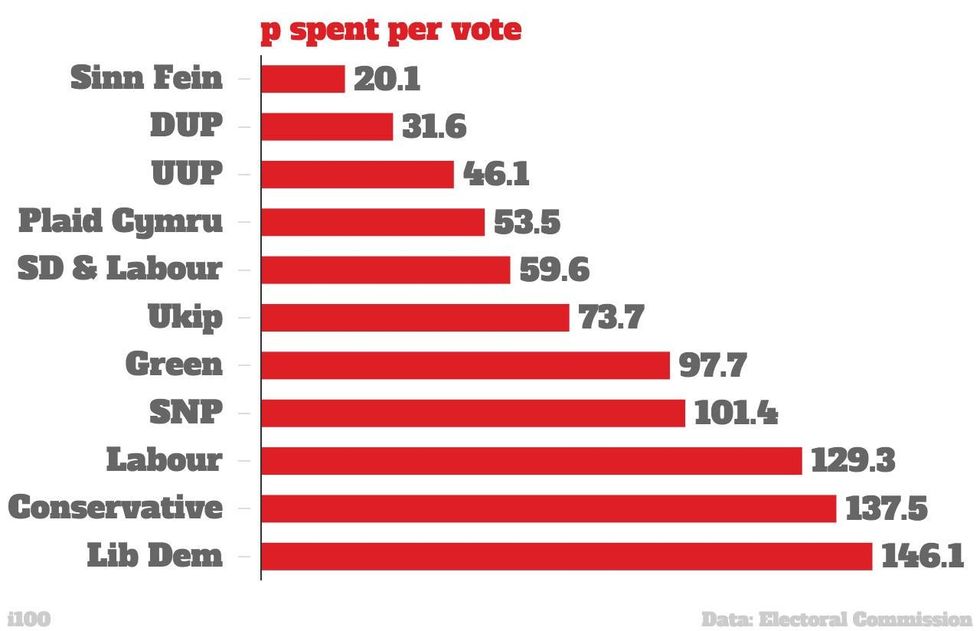
Sinn Fein get the best bang for their buck, winning a vote with roughly every 20p spent, whereas the Lib Dem's fork out the best part of one and a half quid for a vote.
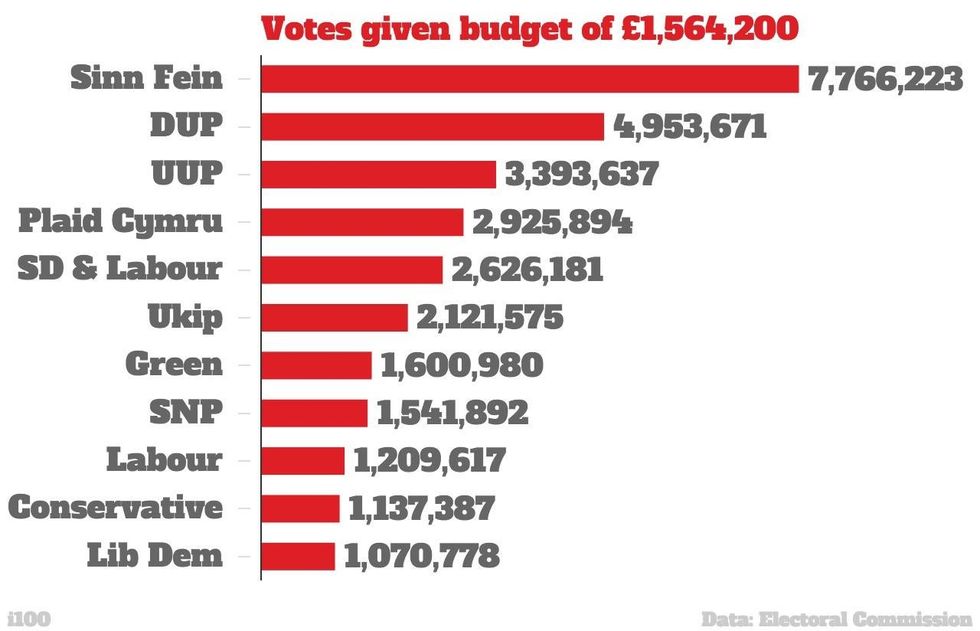
So, given even budgets to win 30,347,830 votes up for grabs, this is what the ratio comes to:
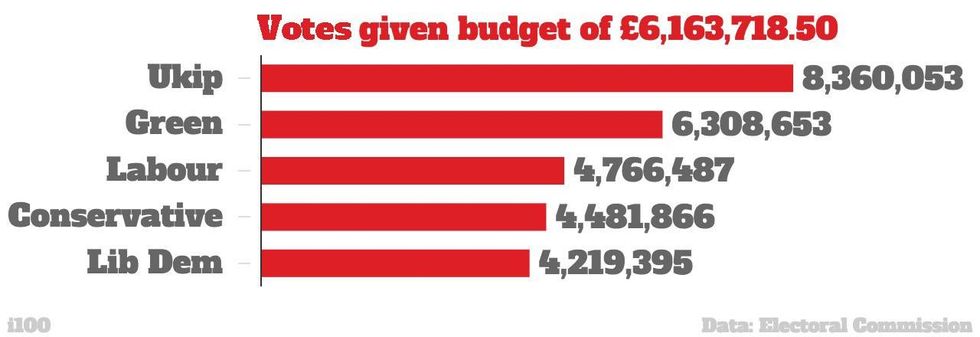
Again, this skews to parties in Northern Ireland and Wales, so taking only parties that competed nationally, who won 28,136,454 votes between them, let's see how the vote share breaks down with equal budgets.
Given an equal budget to fight over this amount of votes, Ukip comes out on top. The total number of votes is slightly larger, to accommodate for the fact that you can't spent a fraction of a penny.

Whether these votes translate to seats or not is another matter.
In fact, all of these tables are rather superficial and based upon rigid ratios which make no allowance for differences in constituencies or regions.
But charts are fun.