The Conversation (0)
Picture:
Spencer Platt/Getty Images
If you took the United States population at a cross section of 100 people, 47 would be white Christians.
This is according to data from the Pew Research Centre's Religious Landscape Study in 2014.
Of 245 million adults in the US, 173 million are Christian - 47 per cent are Protestant.
If the US population was 100 people
It seems like that Muslim minority Donald Trump is so keen on banning from entering the country would be only one person.
Ethnicity
Here's what a rough cross section looks like by ethnicity:
No religion
Men are more likely to be unafilliated than Women:
The North-South divide
While the biggest Christian demographics are found in the Midwest and the South - states which swung in favour of Trump:
The generational divide
However, young people are far less religious than older generations, meaning the church is likely to continue to deteriorate in attendance and support in coming years:
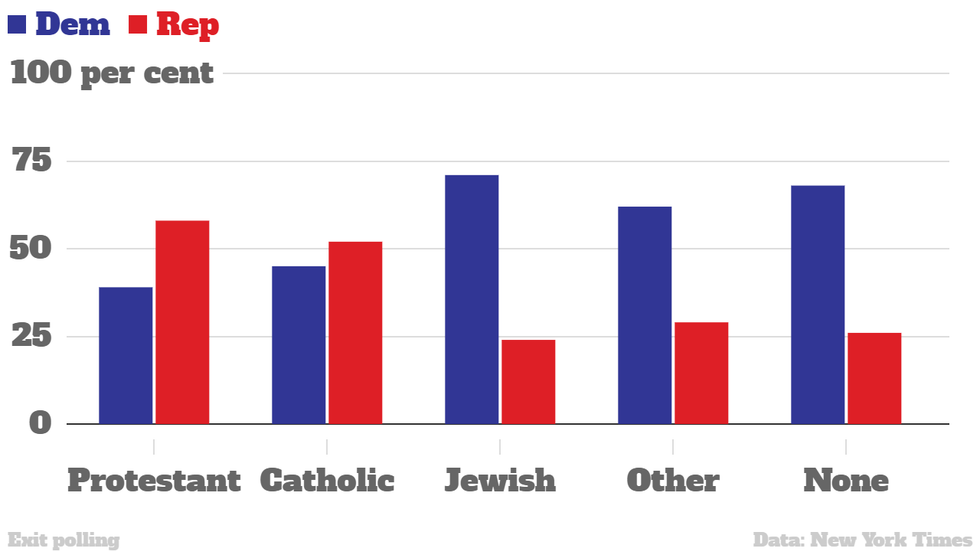
Political affiliation
Christians voted on majority for Donald Trump in the presidential election, while minority religions and unafilliated people voted for Clinton, according to New York Times exit polling:
Top 100