The Conversation (0)

Picture:
Carto/indy100
In the United States 18-29 year olds make up roughly 25 per cent of the electorate, yet in 2012, they cast 6.5 per cent of the votes.
There's an old saying about history being made by the ones who turn up, so let's explore the hypothetical.
Taking a look at historical voter turnout in US elections, the 18-29 year old demographic turned out far less than others in 2012, a trend that has been strong for a number of elections.
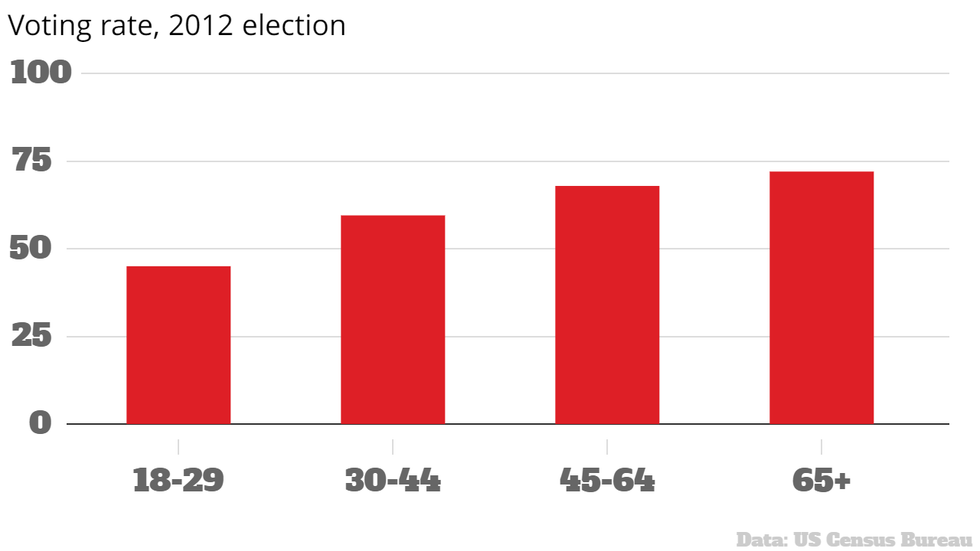
However, annual state-by-state population estimates from the US census bureau suggest this demographic makes up roughly a quarter of the electorate - this can vary on a state-by-state basis, of course.
In addition, exit polls suggested that this demographic were in favour of Clinton over Trump by 55 per cent to 33, (12 per cent voted other).
A point of interest has been what millennials could do to the election results - this survey by surveymonkey has gathered particular interest, despite the unreliability of online polls.
It will be very hard to answer this question until the Federal Election Commission releases the full election results dataset, until then we're all stabbing in the dark a little with exit polls. We thought we'd add our attempt.
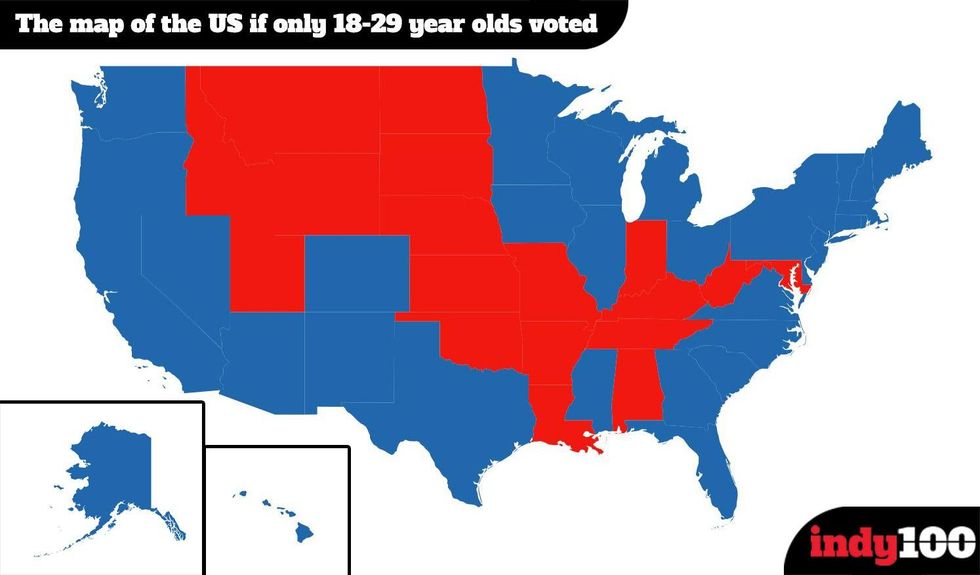
So what would happen if millennials were the only ones to have voted in the election?
 Picture: Carto/indy100
Clinton wins with 420 electoral votes to Trump's 118.
States flipped from Trump to Clinton:
- Alaska
- Arizona
- Florida
- Georgia
- Iowa
- Michigan
- Mississippi
- North Carolina
- Ohio
- Pennsylvania
- South Carolina
- Texas
- Wisconsin
We attempted to find this out by taking population data from the US census and finding the proportion of the electorate in each state in each age bracket.
We then used 2012's turnout rate to find a hypothetical amount of the electorate that were 18-29 year old voters, and thus the hypothetical amount of Democrat and Republican young voters.
We then adjusted state results by the ratio of 18-29 voting to national voting and applied this ratio to the number of 18-29 year old Democrat and Republican voters in each state.
It's a crude simulation that takes national voting patterns and applies them to a state level, but we're not pollsters - forgive us.
This method has a lot of flaws - the first being that we don't know the actual youth vote turnout until all the votes are counted and we've assumed it stayed roughly the same from 2012.
The second being it assumes a two horse race. The third being it takes national trends among demographics and applies them to individual states.
What it can tell us, however, is that if the youth vote energised and turned out every election like older demographics, Clinton,may have had much easier road to the White House.
As it is, they don't, and Trump is the next President of the United States.
More: The most terrifying chart about Donald Trump's victory
Top 100