The Conversation (0)
News
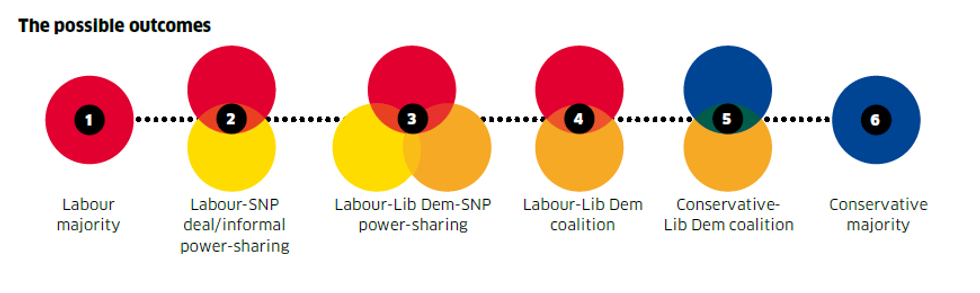
The opinion polls are all pointing towards a hung parliament, and these seem to be the most likely outcomes.
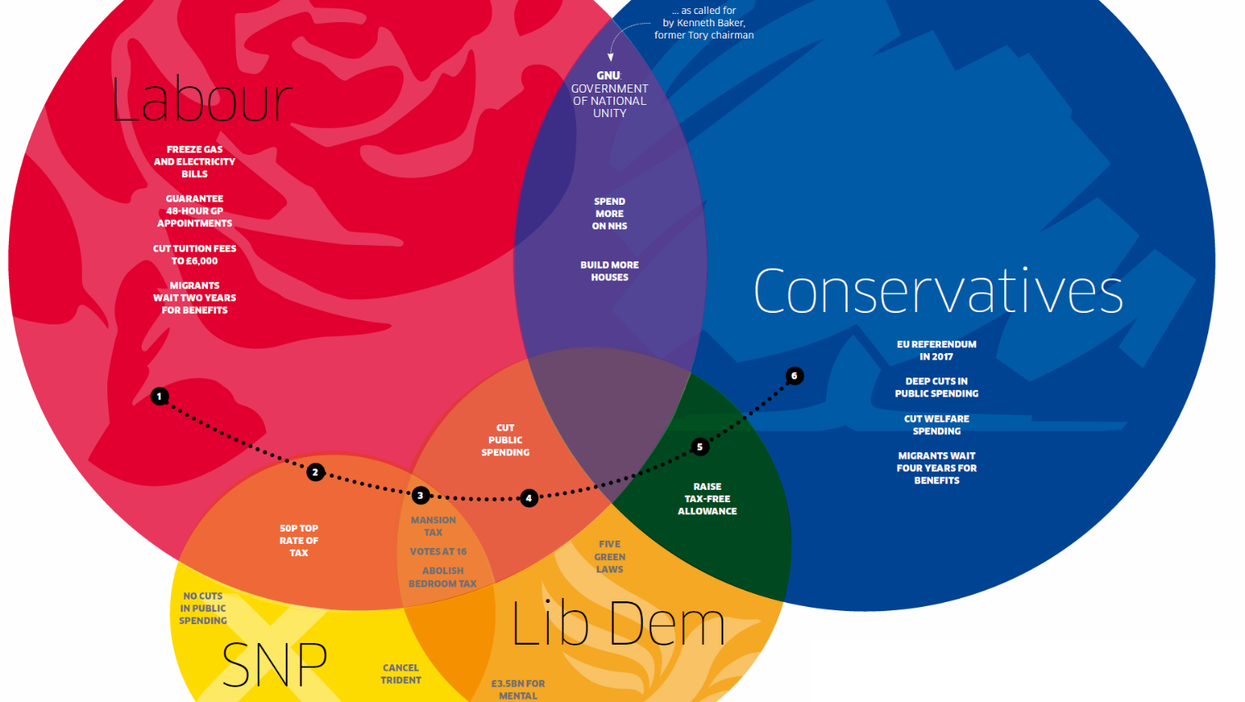
In the large Venn diagram above, the four large circles represent the parties forecast to win more than 20 seats in the Commons, with the five smaller parties below.
In each circle we have summarised the parties' main policies, and tried to identify those on which they share common ground in overlapping territory.
Could these policies form the basis of agreements between the parties, whether in a coalition, pact or confidence and supply arrangement?
Click here for a version of the Venn diagram you can zoom into
More: [We asked 10 polling companies to predict the election result]3
More: [One of these men was voted the most honest person in the leaders' debate]4