News
Louis Dor
Oct 09, 2015

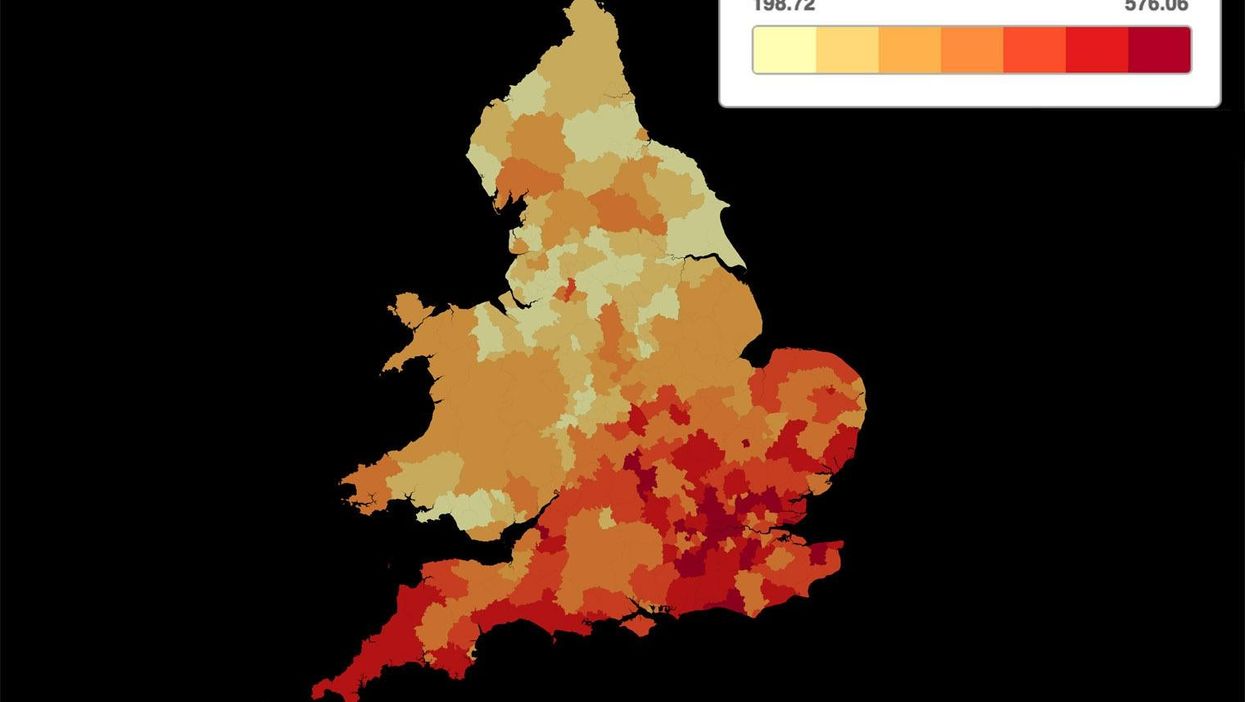
Per cent increase in house prices since 1995
In the last twenty years, in the area where house prices rose least in England and Wales, they still doubled.
The Office for National Statistics releases datasets on house prices in England and Wales for over the past twenty years, down to the local authority area.
Between 1995 and 2014, median house prices rose by the largest percentage in London and the South East, meaning the most expensive areas of the country are only becoming more so.
Nine of the top ten for biggest increase in value come from London, which shows the astronomical rise in property value in the capital over the last twenty years.
Only Brighton and Hove (in ninth) placed in the top ten from outside of the capital, with median house prises having risen 430.8 per cent since 1995.
The top ten areas in terms of rise in house prices (not accounting for inflation) are as follows:
The biggest risers:
1. City of London - 576.1 per cent
2. Kensington and Chelsea - 557.5 per cent
3. Westminster - 548.1 per cent
4. Hammersmith and Fulham - 468.4 per cent
5. Wandsworth - 463.2 per cent
6. Camden - 453.3 per cent
7. Hackney - 451.3 per cent
8. Lambeth - 441.9 per cent
9. Brighton and Hove - 430.8 per cent
10. Haringey - 426.3 per cent
The smallest risers:
1. Isles of Scilly - 96.2 per cent
2. Knowlsey - 146.4 per cent
3. Blackpool - 150 per cent
4. Blaenau Gwent - 154.2 per cent
5. Rhondda Cynon Taf - 163.9 per cent
6. Burnley - 165.6 per cent
7. Merthyr Tydfil - 169.2 per cent
8. Wyre - 169.6 per cent
9. Hyndburn - 170.9 per cent
10. Neath Port Talbot - 172 per cent
To see the full results, browse the interactive map below:
More: 7 signs the London property market is truly broken - showers are in kitchens everywhere
Top 100
The Conversation (0)


