The Conversation (0)
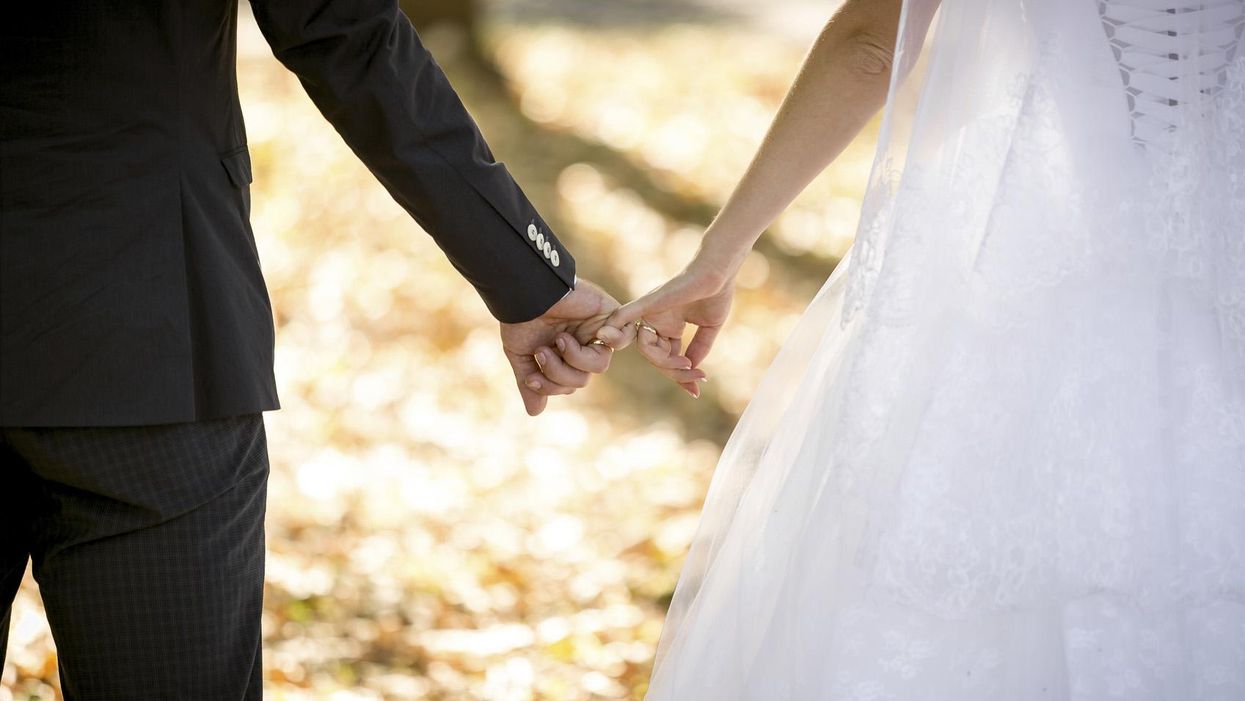
Picture:
Getty Images/iStockphoto
If you look at long-term trends, people are getting married less and getting divorced more.
But when are you most likely to dive headfirst into this flawed promise-based premise?
The below visualisation in Tableau, made by Robert Chase, demonstrates the age at which Americans most frequently married in the past 12 months:
The short answer is 26, with a bit of variation based on demographics.
You can fiddle with the demographic options to find the likelihood, even to a state level.
Using ONS data we've replicated the chart with data from the Office for National Statistics, by the age groups of brides and grooms:
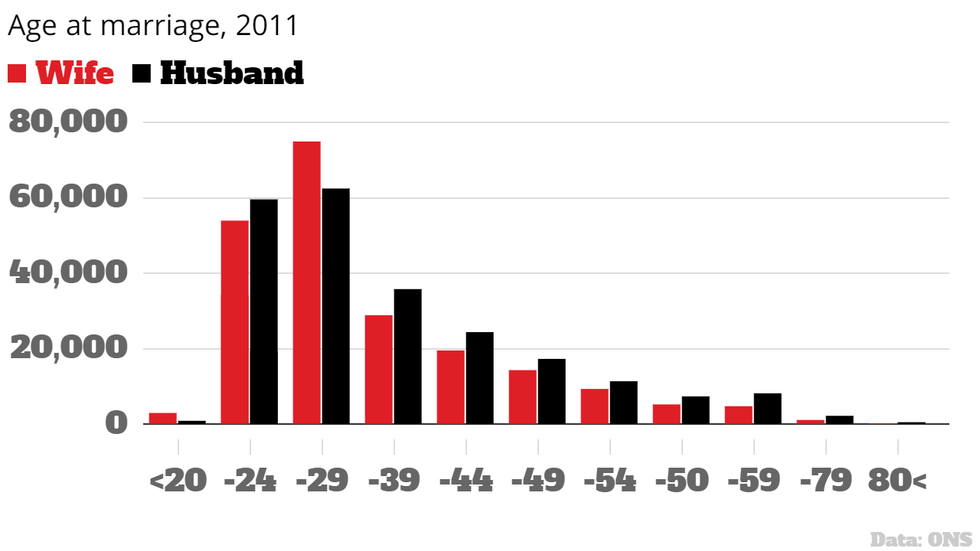
The chart shows that brides are only more likely to get married than grooms in the 24-29 age group and under the age of 20. In all other age groups, grooms are more likely to marry.
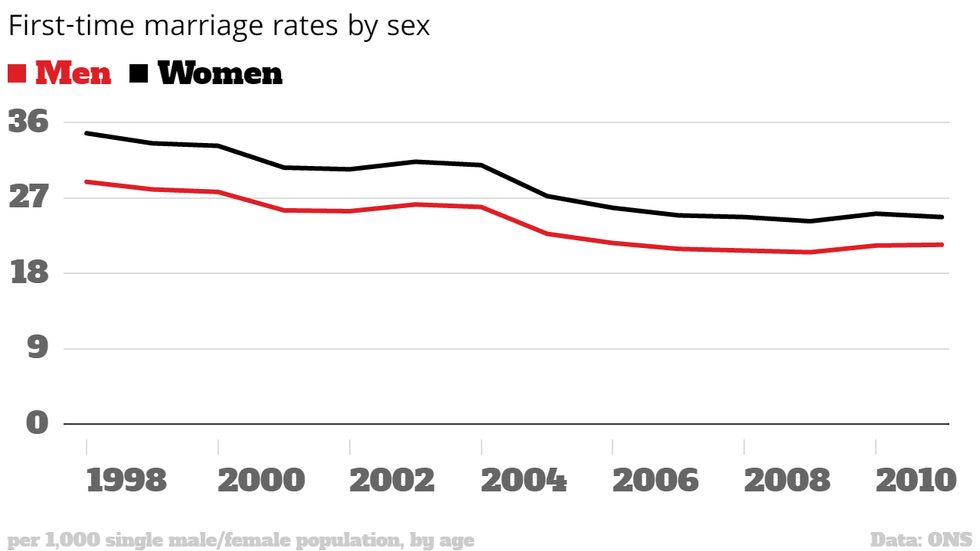
Overall, first-time marriage rates were declining until 2011:
It's known that married couples or couples in a marriage-like commitment have a lower breakup rate than unmarried couples who have been going out for the same amount of time.
As Michael Rosenfeld, a sociologist at Stanford, said in 2014:
The longer a couple stays together, the more hurdles they cross together, the more time and effort they have jointly invested into the relationship, and the more bound together they are.
More: Wedding photographers reveal the moment they realised the marriage was doomed
Top 100