The Conversation (0)
News

A new report by the Joseph Rowntree Foundation has calculated the monetary cost of poverty, and it is much more than you would think.
According to Oxfam, one in five people in the UK live below the poverty line, over 13 million people.
The report looks at how much the UK spends on poverty in comparison to public services, as the below chart by Statista breaks down:
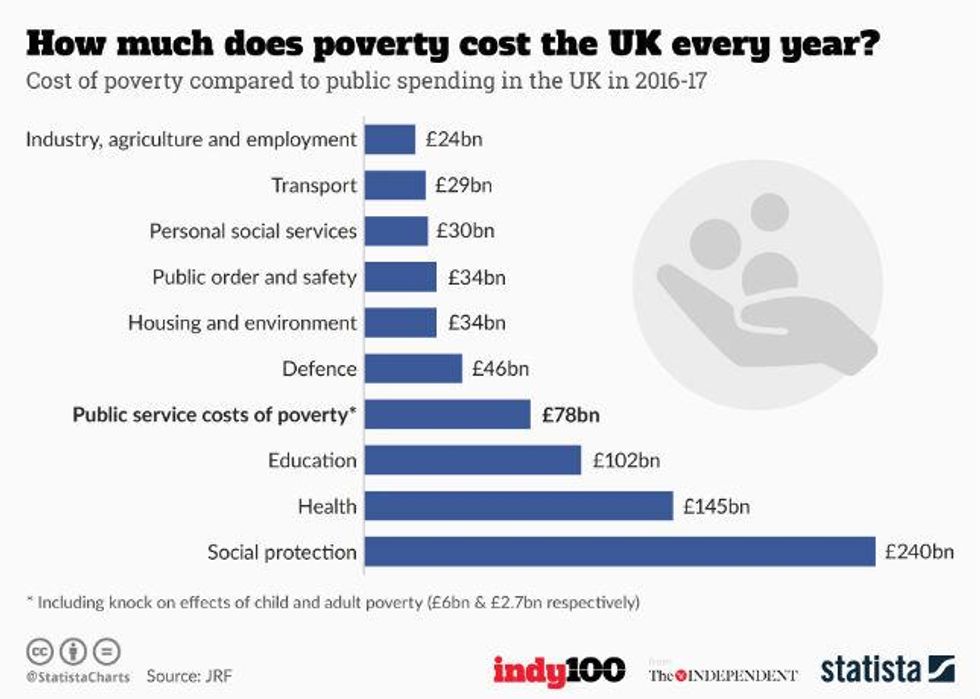
The results show that the public service costs of poverty is £78bn per year, more than spending on Industry, agriculture, employment and transport combined.
Healthcare accounts for £29bn associated public spending on poverty, followed by schools (£10bn) and police and criminal justice (£9bn).
In other words, four per cent of the UK's GDP is spent on extra costs related to poverty.
The report estimates that:
[There are] additional current spending on services associated with the existence of poverty. It also estimates some longer-term consequences of poverty to the Treasury, in terms of reduced revenues and increased benefit payments.
Poverty and social disadvantage affect people’s lives in various ways that trigger additional public expenditure.
More: How the UK is failing miserably on child poverty - in two charts
More: This map shows the most poverty stricken nations in Europe