The Conversation (0)
News
A senior university lecturer has mapped the UK by generation to help demonstrate the extent of the housing crisis.
In a Huffington Post blog, Alasdair Rae, senior lecturer in urban studies and planning at the University of Sheffield, wrote:
The UK is also in the midst of a housing crisis, with affordability, lack of supply, and demand for social housing combining to form what some have described as a toxic mix.
“Understanding the nature of the demographic balance in each area helps us identify current - and future - housing needs.
We need some of the housing wealth from the older generations to pass down to the young, and just not in the form of inheritance tax breaks when our older generations are no longer with us.
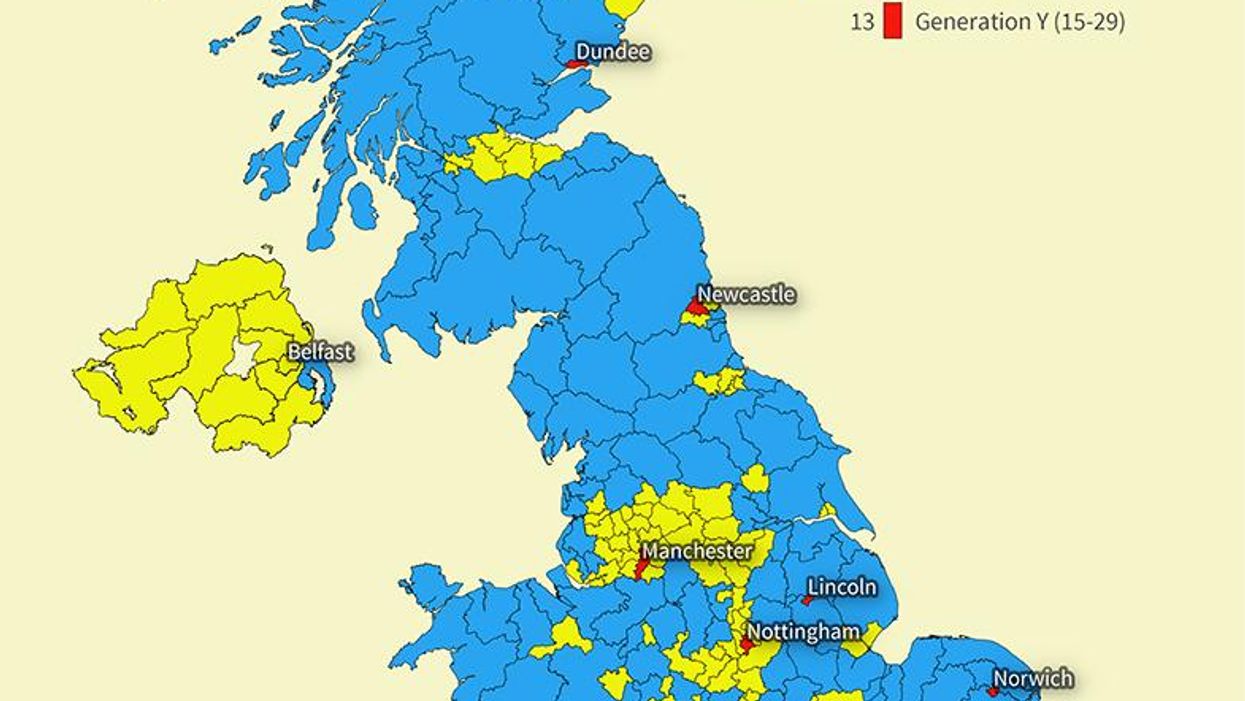
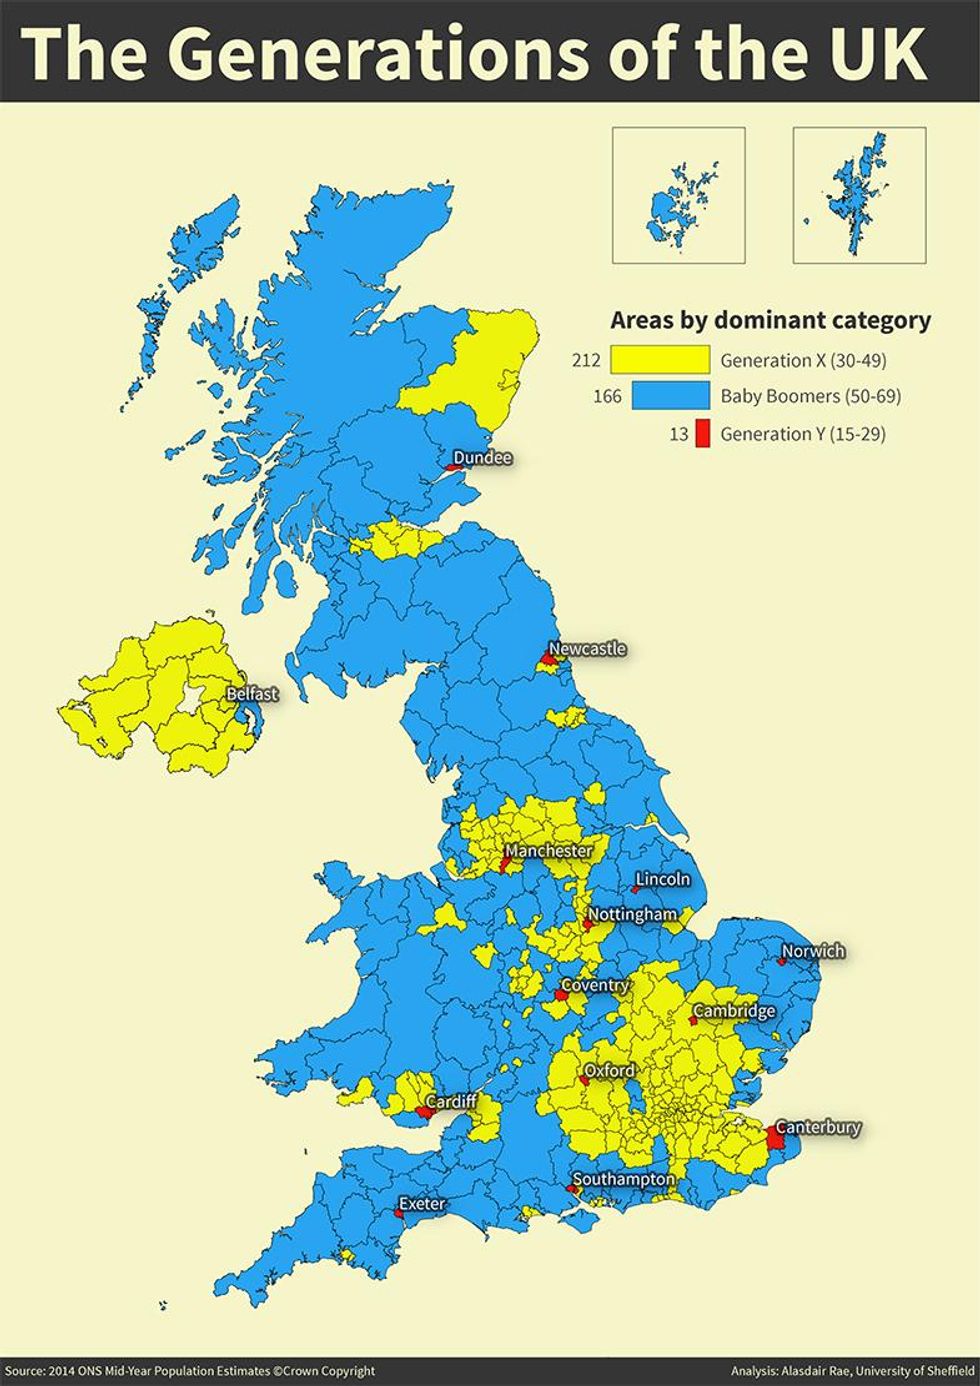
The map shows the dominant generations in all 391 UK local authority areas.
In 212 of these areas, notably a lot of the South East, Generation X (ages 30-49) is dominant, compared to 166 Baby Boomer (ages 50-69) dominated areas.
Generation Y (15-29) is dominant in 13 areas, predominately university towns due to high student populations.
Dr Rae advised a greater focus on the housing crisis using his analysis, insisting that breaking down predominant demographics in housing areas helps identify current and future needs.
Numbers and statistics can be used to produce interesting maps and charts but, much more importantly, they can help us understand current and future policy problems.
That's the real message here.
In a survey earlier this year, over half of 40,000 first time buyers said they had given up on saving for a home.
More: These posters are a reminder of the crisis politicians can't ignore