


The Conversation (0)
Louis Dor
Jun 11, 2017
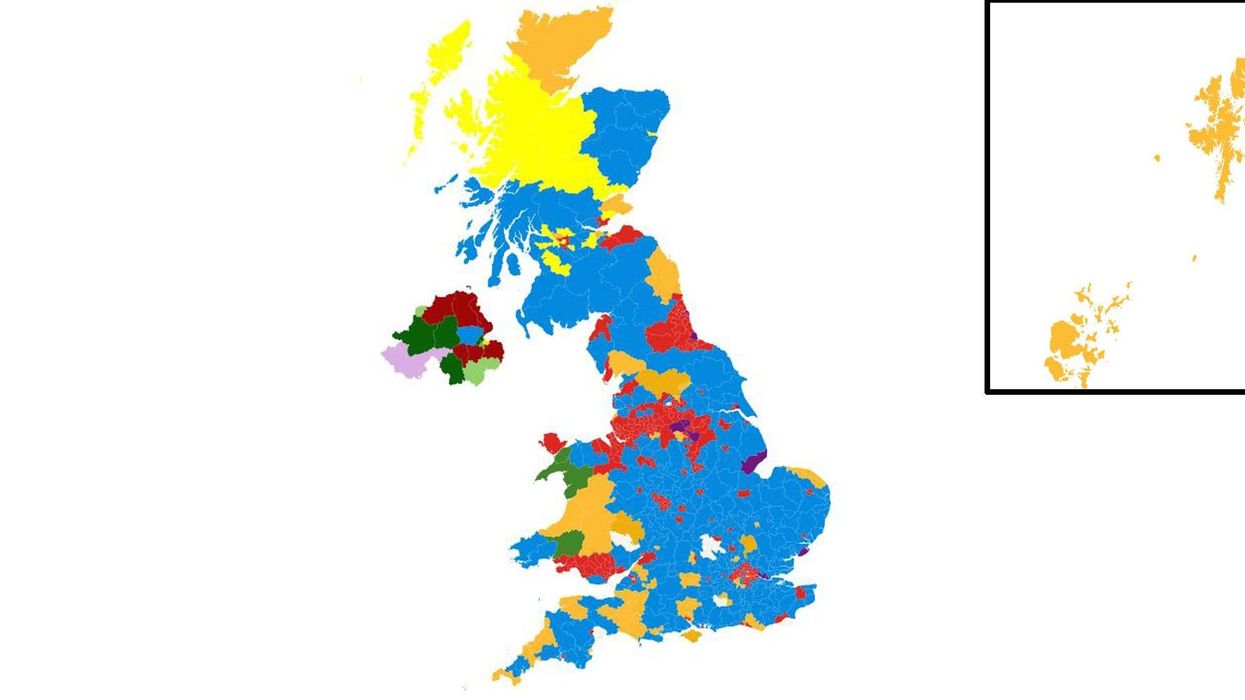
Picture:
Carto/Louis Doré
Earlier this week, the UK awoke to a hung parliament for the second time in a decade.
While Theresa May manoeuvres to create a government with a working majority (apparently through the DUP), the question of electoral reform has been raised again.
The current system, first past the post, is supposed to elect governments with majorities, favouring an electorate that will choose between two or three major parties.
However, in the most recent election, 71 seats went to parties other than the Conservatives or Labour (including the Speaker) - nearly 11 per cent of the House of Commons.
Those parties, who acquired 17.7 per cent of the votes, may feel a little hard done by in this situation.
For example, the Liberal Democrats might cry foul that they received 7.39 per cent of the vote and only received 1.85 per cent of the seats, while the Scottish National Party received 5.38 per cent of the seats from 3.04 per cent of the voteshare.
The SNP might reply that they contested far, far less seats.
So what would the UK look like under an electoral system of proportional representation?
Here's our best stab at it:
We got to this by taking the total number of seats each party would win if the House of Commons was divided by voteshare.
This is as follows:
- Conservative, 276
- Labour, 260
- Lib Dem, 48
- SNP, 20
- Ukip, 12
- Green, 10
- DUP, 6
- Other, 6
- Sinn Fein, 5
- Plaid Cymru, 3
- SDLP, 2
- UUP, 1
- Alliance, 1
This is where it gets tricky.
Under many systems of proportional representation you can select a number of parties and indicate second or even third choices.
We're faced with filtering a system of one vote, one choice, into a system where the Green party supposedly win 10 seats nationally.
Here's how we approached this problem:
We take every seat in the country and rank it for each party, according to the voteshare that each party earned in the constituency.
We then allocate parties to seats, based on how they performed in each seat.
We worked from the smallest party up to the largest in allocating seats, in order to retain some fidelity to location specific parties in Northern Ireland, Scotland, and Wales.
For example, under our system of proportional representation, Alliance won the seat they won the most voteshare in - Belfast East - then we move onto UUP, who win the seat they won the most voteshare in - Fermanagh and South Tyrone.
And so on and so forth.
However, some unneccessary crossover occured, for example Labour being allocated Conservative seats where turnout was high, and Conservatives winning Labour seats where turnout was low.
To adjust for this crossover, we returned seats to First Past the Post winning parties as much as possible, based on where the voteshares for winning parties in each system were furthest apart.
Attempting to keep the amount of seats whose leaders were not the ones the constituency chose to a minimum, we end up with 95 seats changing hands.
This is where we get to the grizzly numbers.
Of the constituencies that switch hands, the average difference in voteshare between the winning party under our horrible PR system is 21.3 per cent.
The least fair unseating of a victorious MP occurred in Hackney North and Stoke Newington, where the Green Party's Alastair Binnie-Lubbock (4.1 per cent of the vote) nabbed Diane Abbott's (75.1 per cent) victory from her.
However, if you take a national average of all constituencies, it is 3.1 per cent difference (because 555 stay the same).
Here's a list of all the constituencies that change hands:
It's not a perfect system, we concede. We're sure the boffins at Number 10 would design something much fairer with the assistance of actual mathematicians.
It does, however, provide a glimpse of something to think about.
More: Here's how the 2015 election results would look under a proportional voting system
Top 100