


The Conversation (0)
Moya Lothian-McLean
Jun 17, 2020
Getty
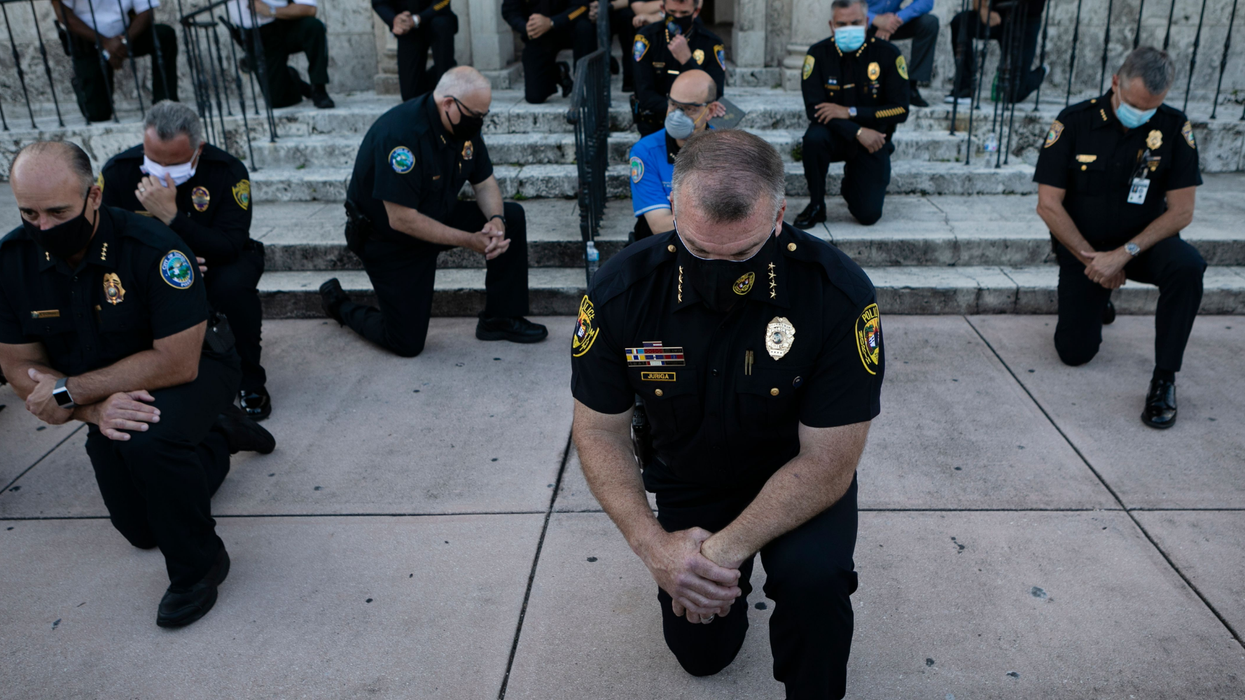
Police brutality in America and the racial bias in who is on the receiving end should not be news.
Yet there are still some who refuse to believe that law enforcement disproportionately use force on ethnic minorities, predominantly black and hispanic communities.
Staggering, especially given that even while current protests against police brutality rage on, more unarmed black men have been killed by police.
But now a new graphic lays bare just how affected minority communities are by police violence – and people are shocked.
Originally published in a Washington Post article, the graphic breaks down the more than 5000 fatal police shootings that have happened since 2015, according to the ethnicity of the victim.
It shows that black Americans are killed at more than twice the rate of white ones.
The graphic reveals that while black Americans make up only 13 per cent of the population, they are 43 per cent of victims killed by the police, per million people.
Hispanic people are also disproportionately affected, at only 12 per cent of the population but representing 33 per cent of people shot dead by police.
White Americans make up only 17 per cent of victims, despite representing 60 per cent of the total US population.
The Washington Post also reports that black men are four times more likely than white people to be killed by police when unarmed.
The graphic quickly circulated.
Some used it to debunk the claims that white people are killed more by police – they are technically, but not when placed into context.
Others said it showed the power of visual aids at driving home a message.
Some still despaired at the denials though.
It was pointed out that other ethnic minority communities likely were feeling the brunt of disproportionate force too.
All in all, a very useful – and distressing – graphic.
Change is needed.