The Conversation (0)
News
It is 70 years to the day since India shed the shackles of colonialism and became a free nation on August 15 1947.
India’s independence was marked by violence, having come a day before the partition which gave birth to Pakistan.
Nevertheless, despite its rocky start, the country has become a key player on the world stage.
First Post collated GDP data, analysed India’s foreign reserves over time, population and the import/export industry to come up with a number of statistics which say a lot about the country’s development.
For India's 70th independence anniversary, Statista used this data to create graphs which demonstrate India's growth:
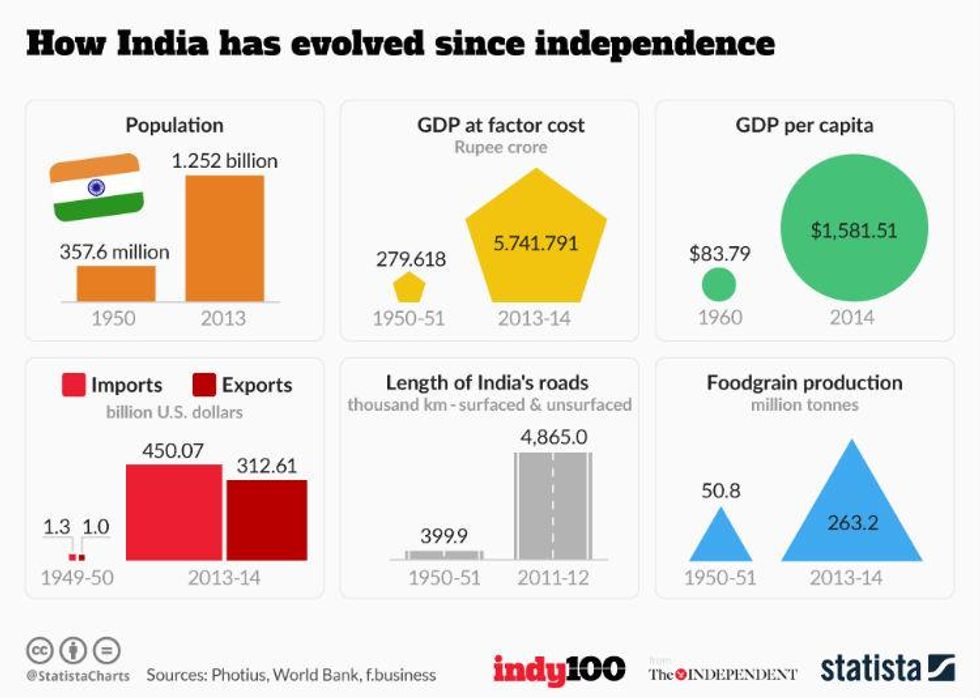
One of the most obvious changes relates to India's population, which ballooned from 357.6m to 1.252bn in under 70 years.
GDP per capita continues its upward trajectory, from $83.79 to $1,581.51 by 2014.
In 2015 India was eighth in the largest global economies, and economists predict that by 2030 the country will be the third largest economy in the world.
Despite rocketing economic success, serious issues - such as the conflict surrounding Kashmir, which injured seven soldiers on Monday - and rampant inequality, continues to be barriers to India's growth.
More: A graph that shows the rise of nationalist political parties in Europe
More: These portraits of people who identify as India's 3rd gender group are stunning