


The Conversation (0)
Joe Vesey-Byrne
Nov 15, 2020
After four long years of arguing, Brexit, as it stands will finally happen on December 31, when the UK leaves the European Union, deal or no deal.
The road to Brexit has been rocky, to say the least.
On the one side, you have Remain voters: people who strongly believe that we are better as a part of the EU, that we are stronger together and it is this special relationship with our European neighbours that helps make Great Britain to be so great. Then, you have the Leave voters, who think that our pals across the sea are the thing that's holding us back the most. That, really, we'd be far greater on our own if we could just release ourselves from their pesky hold.
The reasons amounting to both trains of thought are many but stripped back to their basic form this is essentially what they amount to. One side likes being part of the EU, the other does not and neither side can really agree on anything in between.
But following the 2019 general election, the result was clear: we're leaving and that's what happened on January 31, 2020.
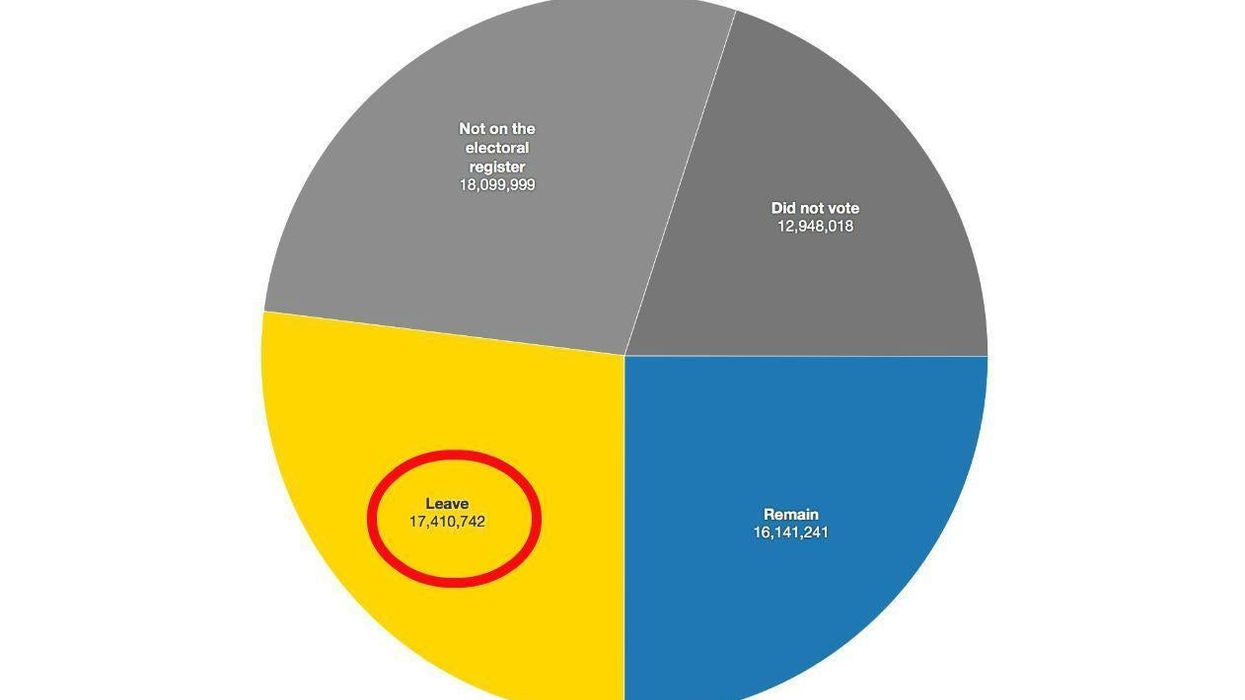
Brexit supporters have often bellowed loudly about the sheer amount of people who voted to get us out - the not inconsiderable number of 17,410,742. They've often said that ignoring such a number would be a betrayal of the highest order, a clear majority voted and that's that.
But did the majority really vote to Leave?
In response, the below graph and other versions of it, keep being used by Remain supporters to invalidate the Leave verdict.
Of course, things are never that simple. So let's break it down.
The number of persons not on the electoral register was calculated by subtracting the size of the electorate as of 22 June 2016, from the ONS record of total UK population published on 26 February 2016.
A person may not be on the register by their own choice, or due to ineligibility such as not yet being old enough, being in prison, or not possessing UK citizenship.
EU Citizens living in the UK were ineligible unless they were from Malta, Cyprus, or the Republic of Ireland.
Members of the House of Lords are usually ineligible to vote at UK General Elections, but were allowed to vote in the EU Referendum.
British citizens who had lived abroad for more than 15 years were included in the 'Did not vote' category, as they are on the electoral register but were not permitted to vote in the referendum (nor are they allowed to vote in other UK elections).
In total, the electoral commission reported that the size of the electorate on referendum day was 46,500,001, and 72.1 per cent of that turned out to vote.
This chart is not an entirely convincing argument against Leave or Remain, but it does illustrate that 'the 52 per cent' and 'the 48 per cent' actually constitute much smaller proportions of the UK population than the figure might imply.
There are more people not on the electoral register than voted for either campaign, and the non-voters are only marginally smaller than either campaign's share of the vote.
The onus for the outcome falls on those who are registered but did not vote, who would be stuck with a decision which they did not choose, and those who are eligible to vote but have not registered.
Either way, it appears that the argument has (for now) been settled.
Now for a deep breath and a giant leap into the unknown.
More: Here's a list of all the people who can vote in the EU referendum, and those who can't
More: The most terrifying thing about today's tabloid front pages