


The Conversation (0)
News
After the 'Vote Leave' campaign won the 2016 Brexit referendum on whether to stay in the European Union or not, it's no surprise to many people that the country is politically divided.
However, just how divided it is, and how differently separate demographics vote, is exemplified by these incredible maps.
According to new data collected with a YouGov poll, and then compiled by Election Maps UK, if only 18-24s were allowed to vote in the next general election, the Conservative party would not win a single seat.
The map for this age demographic showed that if only young people were allowed to vote, Labour would win an impressive 600 seats, the Lib Dems would take 21, the SNP would take 9, and the Green Party would take 1.
The result is also a map bathed in red:
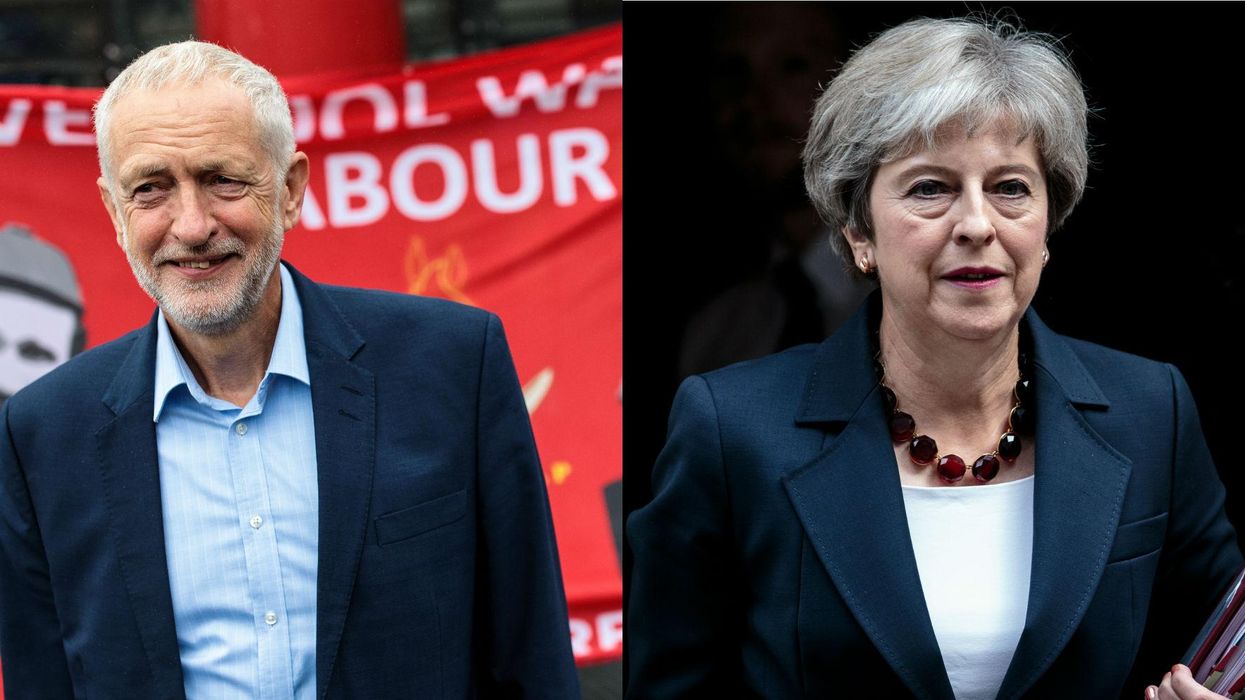
However, as we're all extremely aware, the last general election to take place in the UK in 2017 did not result in a sweeping victory for Jeremy Corbyn's Labour, but instead it saw more and more constituencies on the map turning blue.
In the end, the Conservatives won 316 seats, and were taken to victory by the DUP, who propped up the government and gave them a majority with their 10 seats. Labour, on the other hand, won 262 seats.
This can perhaps be explained by the incredible difference illustrated by the map showing how the general election would look if only over 65s were given the vote.
Unsurprisingly, the entire map of the United Kingdom has pretty much turned blue.
In this instance, the Conservatives would win 62 per cent of the votes, meaning 575 seats, Labour would win 32, the SNP 15, the Lib Dems 7, and the Green Party 1 seat. UKIP wouldn't win a single one.
The complete picture can be seen clearly in this third map.
Speaking to Joe, the people behind the maps commented:
People always talk about the growing divides in UK politics, especially among different age groups.
I wanted a way that my followers and I could visualise the stark differences in political views between the youngest and oldest in our society, and many, including myself, were shocked at just how colossal these differences were.
I think like most people, I knew there would be a huge gap between young and old, especially considering all the talk of a 'Youthquake' after the 2017 general election.
However, I never expected the differences to be as extreme as they were. It just goes to show how divided this nation is, particularly in the aftermath of Brexit.
HT Joe