News
Samuel Osborne
Apr 21, 2015

New data has shown just how voters from 2010 are likely to change their vote in the 2015 election.
YouGov interviewed 31,210 individuals on the eve of the 2010 election and have now interviewed them again to find out who they'll vote for on May 7th.
The graph shows how the Conservatives have lost voters to both Labour and Ukip. According to YouGov:
It is now clear how the initial Tory strategy was wrong. To form a majority, Cameron needed to find new votes, but the strategy was to defend a weak position, and the chart shows how the votes have leaked on left and right.
The majority of Ukip support comes from ex-Tory voters, rather than those who voted Ukip in 2010. They're also pulling in a similar number of voters from Labour, the Conservatives and the BNP (!).
The Green Party have stolen a large number of votes from those who voted for the Liberal Democrats in 2010 meanwhile.
But a similar number of people who voted Labour and Conservative in 2010 have said they don't know which way they'll vote in 2015.
The graph also shows that Labour are likely to win votes from each of the major parties.
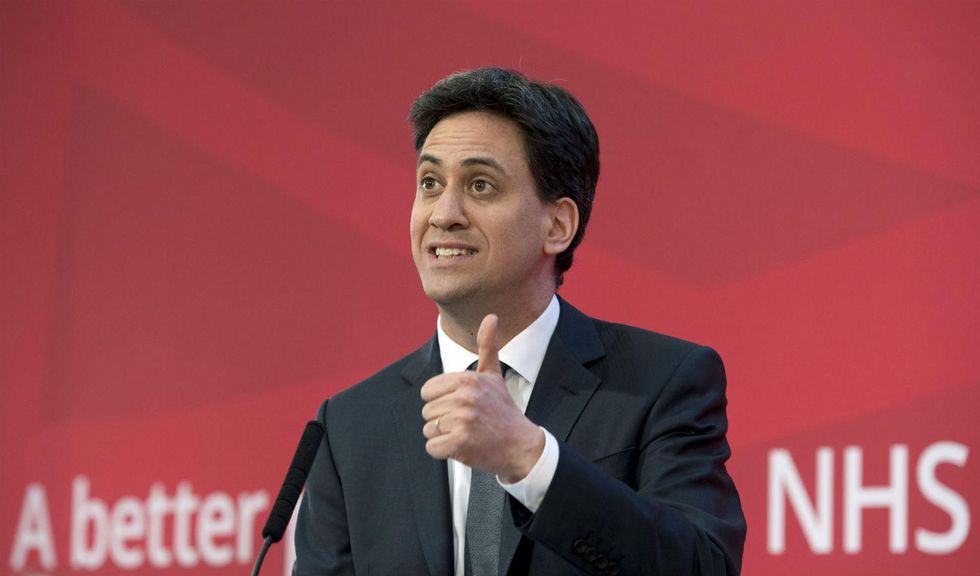
The chart also shows [Ed] Miliband's strength: he has won something from everywhere, especially the Liberal Democrats. He may yet be declared a strategic genius: with the Tories locked in defence, all he really had to do was gain some credibility, allay the worst fears, and muddy the policy choices a little. His campaign so far has achieved that.
For the full data and analysis, go to YouGov.
More: These are the most popular political parties at leading British universities
Top 100
The Conversation (0)


